Atomically thin two-dimensional materials represent the next generation in photovoltaics, quantum computing and related applications. In order to exploit such materials, a thorough understanding of material parameters and in-situ characterization during device growth and fabrication is required. Transition metal dichalcogenides (TMDs) are a subset of these single-layer materials that are most popular for their semiconductor and optoelectronic applications.
Nonlinear microscopy and spectroscopy combine improved spatial resolution with enhanced sensitivity to defects, doping, and deformation in these materials while providing access to sample dynamics, including charge transfer and coherent coupling. The numerous TMDs cover a wide range of wavelengths with different resonance energies and linewidths of these resonances. Using the Coherent Vitara T laser, researchers at the University of Michigan and scientists at MONSTR Sense Technologies are demonstrating the capabilities of the BIGFOOT® ultrafast spectrometer and NESSIE® laser scanning microscope to understand and characterize temporal coherence, coupling, charge transfer, and sample quality in TMD monolayers and heterostructures. A schematic and picture of the experiment is shown in Figure 1.
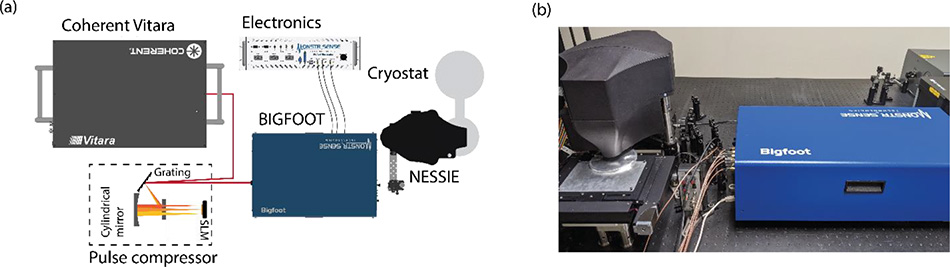
Figure 1:
(a) Schematic of the experimental setup: a Coherent Vitara T laser beam is sent through a pulse compressor for pump precompensation. It then passes through a BIGFOOT spectrometer and a NESSIE laser scanning microscope before striking the sample inside the cryostat. Due to its high reliability and keyless operation, the Vitara T laser system is ideal for sophisticated instruments such as BIGFOOT and NESSIE.
(b) Image of assembly with XY microscope platform for wafer scale imaging. Courtesy of MONSTR Sense Technologies.
ULTRAFAST MOVIES - A VISIT TO A QUANTUM CINEMA
The basics of ultrafast imaging are shown in Figure 2: A laser pulse, often referred to as a pump pulse, excites the sample. A second pulse, referred to as the probe pulse, follows the pumping pulse. During the delay of the pump and probe pulses, T, the system undergoes evolution - e.g., exciton decay in straight-gap semiconductors, electron relaxation in graphene, vibrations in molecules and lattices, and charge and energy transfer in photosynthetic bacteria. We understand these ultrafast processes by measuring changes in the nonlinear response of the system, specifically the four-wave mixing (FWM) signal, as a function of pulse delay. By combining this measurement with a laser scanning microscope, we produce ultrafast "movies" of the sample dynamics.
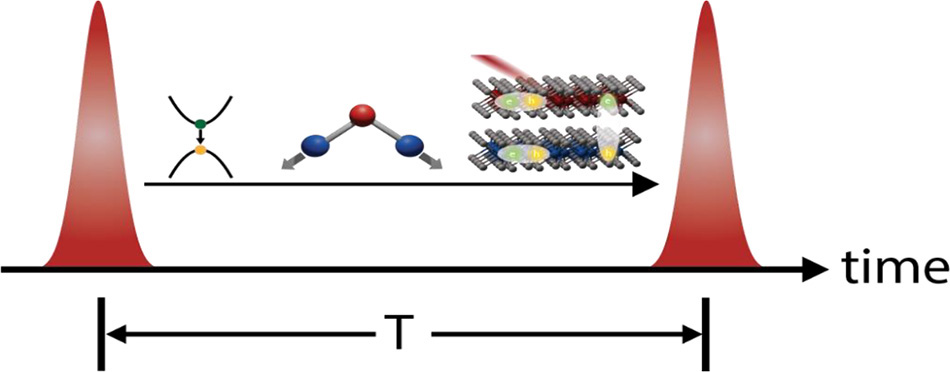
Figure 2: Schematic of the pumping and probing pulse for taking ultrafast movies of sample dynamics. Courtesy of MONSTR Sense Technologies.
The measurement at each pump and probe pulse delay represents a snapshot of the excitation evolution. By spatially scanning the excitation beam over the sample region, the entire image is obtained. An example of such a snapshot is shown in Fig. 3(a). In this example, the MoSe2 TMD monolayer exhibits a decrease in exciton lifetime as shown by the decrease in amplitude with longer pulse delay. A simple exponential fitting can be used to extract the exciton lifetime in the whole sample, as shown in Fig. 3(b). In semiconductors in particular, the lifetime is a strong indicator of changes in doping, localized states (often caused by defects), or changes in the dielectric environment, and thus serves as a probe of material quality. However, pump-probe imaging goes far beyond semiconductors, as it is popular in a wide range of applications, including the detection of malignant melanoma and defects in graphene.
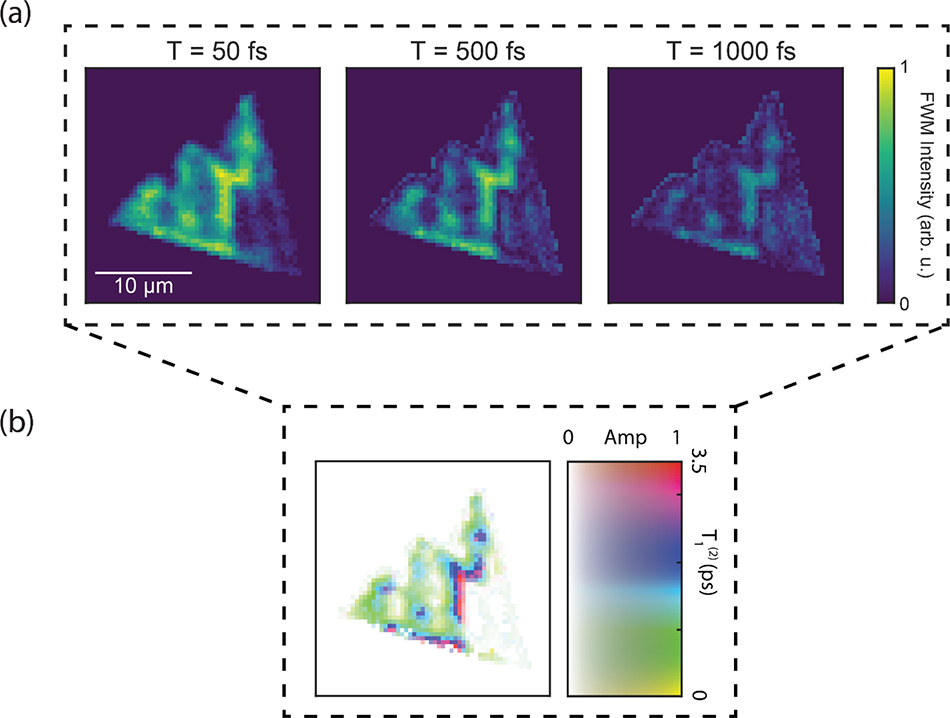
Figure 3:
(a) FWM image for different pump and probe delays T.
(b) Resulting decay time image obtained by exponential fitting in each pixel of the image. Courtesy of Torben Purz.
The spatial resolution of the NESSIE microscope measurement is better than 800 nm. The high resolution is made possible by the fully collinear output of the BIGFOOT spectrometer, which can be contrasted with conventional ultrafast techniques that have a spatial resolution of approximately 30 µm. Not only does the spot size allow high resolution images to be measured, it also allows the use of high repetition rate 80 MHz lasers instead of amplified laser systems. The more than 30-fold reduction in focal spot size enabled by BIGFOOT corresponds to a 2500-fold reduction in excitation area, as well as lower pulse energies required for equivalent nonlinear response. Therefore, the BIGFOOT spectrometer is compatible with laser oscillators such as the Vitara T, which have a high repetition rate and low noise. This has the advantage of reducing the pixel dwell time during imaging and the scan time during spectroscopy, which greatly speeds up data acquisition.
MULTIDIMENSIONAL COHERENT SPECTROSCOPY CAPABILITIES
In some cases, researchers need more information about their sample, especially when studying the coupling between resonances or investigating the temporal coherence (unphasing) properties of samples. For these purposes, multidimensional coherence spectroscopy (MDCS) is commonly used. In MDCS, the probe and pump pulses are spectrally resolved to produce two-dimensional spectra that correlate absorption and emission energies. An example of an MDCS spectrum for the MoSe2/WSe2 heterostructure is shown in Fig. 4. The red dashed boxes in Fig. 4 indicate two peaks with the same absorption and emission energies, which are characteristic features of MoSe2 and WSe2 A-excitons. The yellow dashed boxes, on the other hand, delineate two peaks that have different absorption and emission energies and indicate the coupling between the excitons. The change in delay between pump and probe reveals the time-dependent nature of the coupling. The wide bandwidth of the Vitara laser allows simultaneous excitation of both MoSe2 and WSe2 A-excitons in this experiment. The use of the BIGFOOT spectroscope, which operates on the principle of Fourier transform spectroscopy, allows software adjustable bandwidth and spectral resolution. All this at a higher data acquisition rate than conventional ultrafast spectrometers.
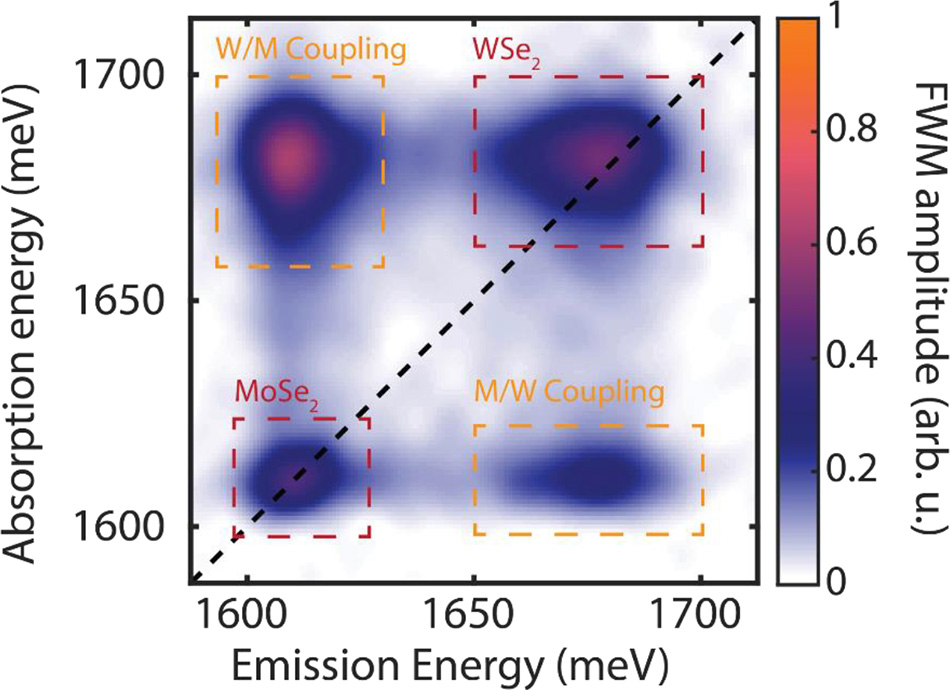
Figure 4: Example of an MDCS spectrum for the MoSe2/WSe2 heterostructure. Courtesy of Torben Purz.
TIME COHERENCE FOR QUANTUM INFORMATION SCIENCE
For complex computations, quantum informatics requires long qubit coherence times. MDCS is a useful tool for measuring optical properties of materials with quantum-information applications due to its unique ability to measure homogeneous linewidths and coupling in materials with large inhomogeneities. MDCS is therefore an excellent tool for characterization in the field of quantum information science. Although TMDs are a promising class of quantum materials, surprisingly little is known about their coherence times and the differences between samples. In this paper, we characterize the coherence properties of TMDs using MDCS. Figure 5(a) shows a typical nonlinear image of a MoSe2 monolayer at cryogenic temperatures (5 K).
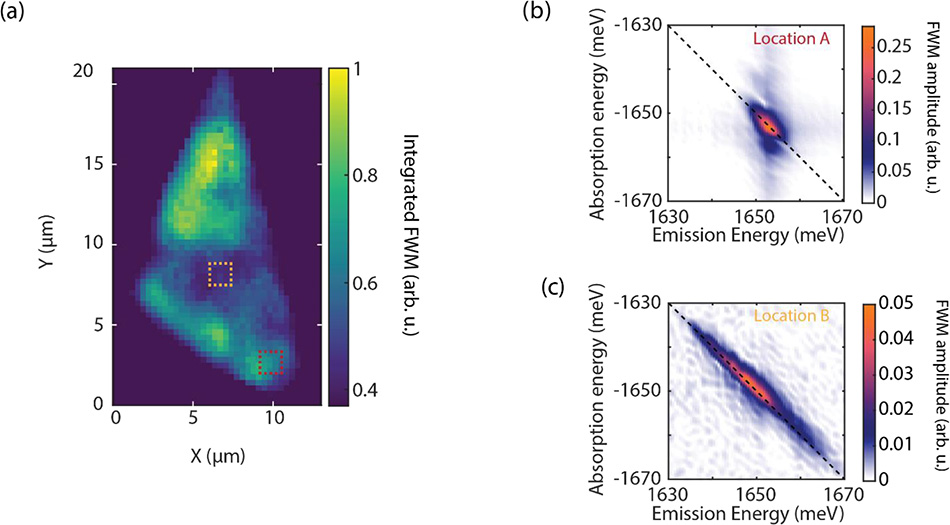
Figure 5:
(a) FWM image of the MoSe2 monolayer at cryogenic temperatures (5 K).
(b) MDCS spectrum at site A (red dashed box in (a)).
(c) MDCS spectrum at site B (yellow dashed box in (a)) [1].
The monolayer shows a distinct inhomogeneity in the FWM strength, which coincides with a crack in the center of the sample. Further analysis by MDCS at two locations in the sample (Fig. 5(b), (c)) shows that the region in the middle of the image also exhibits a markedly inhomogeneous broadening, which is manifested by elongated spectra at location B along the diagonal (dashed line). The inhomogeneity indicates significant resonance shifts induced by strain changes for excitons in the 800 nm excitation region.
The coincidence of the line width across the diagonal quantifies the homogeneous line width, which is inversely proportional to the coherence time. For example, the cross-diagonal linewidth fitting for Fig. 5(b, c) reveals optical coherence times around 900 fs, which is below the required coherence time for a functional qubit unless the qubit operations are ultrafast.
MDCS in conjunction with microscopy can also highlight the robustness of the coherent coupling between excitons and charge transfer in the MoSe2/WSe2 heterostructure. By integrating over the MoSe2/WSe2 coupling peak (bottom right in Fig. 4) while varying the pump and probe delay, we obtain the coupling images shown in Fig. 6(a). The sample exhibits strong deformation, which is evident from the pronounced resonance shifts across the sample.
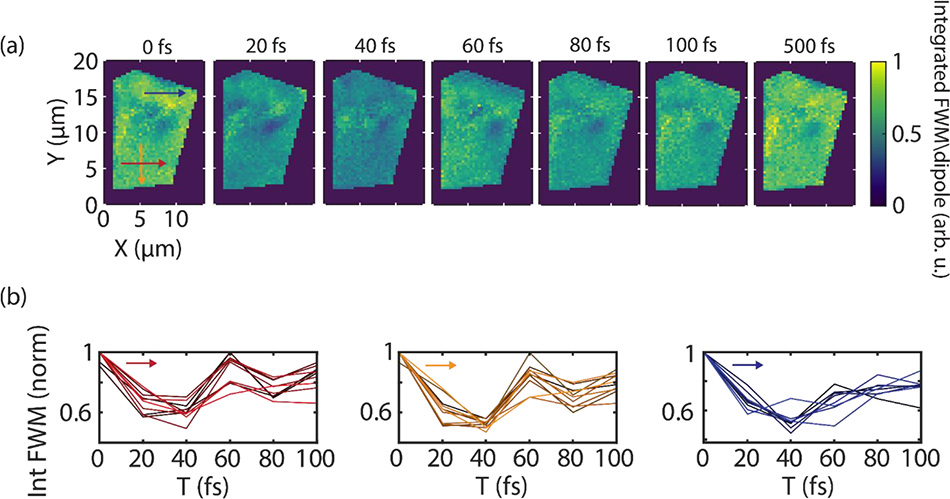
Fig. 6:
(a) Integrated FWM image of the MoSe2/WSe2 coupling peak (bottom right of Fig. 3) versus pump and probe delay T.
(b) Integrated FWM image versus pump and probe delay T along the three arrows in (a) [1].
Figure 6(a) shows the spatial map of the evolution of the coupling peak as a function of pump and probe delay, T. This is one way of decomposing this five-dimensional data set to emphasize our understanding of the physical nature of interlayer coupling. In Figure 6(b), the oscillations of the coupling peak at early pulse delays reveal the magnitude of coherent coupling in the material. The strength of the coupling peak at later pulse delays reveals the strength and spatial uniformity of charge transfer. Data curves 6(b) are plotted for many pixels along each color line in Figure 6(a) to show the reproducibility of oscillations in different regions of the sample.
Despite the short pixel dwell times (up to 30 µs) of the NESSIE laser scanning microscope, it takes more than an hour to obtain the complete five-dimensional measurements presented here. However, the high stability and low noise of the Vitara instrument, together with the high interferometric stability of the BIGFOOT instrument, allow these measurements to provide stable results for several hours.
THE WAY TO FASTER MATERIALS INSPECTION
In order to perform in-situ characterization during material growth and production, we must choose a different method than combining full MDCS with microscopy. The latter is not fast enough. Instead, MDCS modalities such as phasing and population dynamics can be accessed by zero- or one-dimensional time-domain scanning, which the ultrafast MONSTR Sense microscope acquires in less than a minute. These zero- or one-dimensional scans are often sufficient to characterize in-situ or in-line material growth where throughput is important.
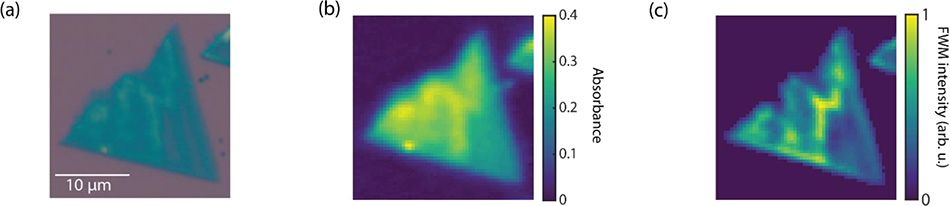
Figure 7:
(a) Microscopy image of WSe2 monolayer without encapsulation grown by CVD in white light.
(b) Absorption image of WSe2 monolayer.
(c) FWM image of WSe2 monolayer [2].
In addition, a simple static FWM image reveals regions with exceptional physical properties, such as phasing or population lifetime, while being significantly faster to acquire. Figure 7. shows a comparison of (a) white light microscopy and (b) resonance linear reflectance with (c) FWM imaging at room temperature. While the white light microscopy image in Fig. 7(a) and the linear reflectance image in Fig. 7(b) show spatial inhomogeneity caused by residues from the transmission process, the FWM image in Fig. 7(c) shows higher contrast and different features from Fig. 7(a, b).
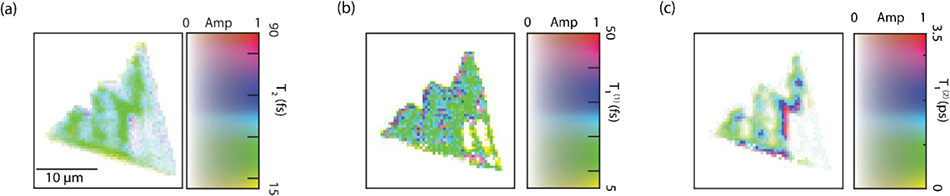
Figure 8:
(a) Time-lapse image of the WSe2 monolayer at room temperature
(b) Image of the fast decay population lifetime.
(c) Image of the slow decay component of the population lifetime [2].
The different properties of the FWM are reflected in different decay times, as shown in Fig. 8(a). The pulse length, set by tuning the Vitara T wide bandwidth and dispersion compensation, is 30 fs. The regions with significantly longer dephasing times are the regions with high many-body effect. Similarly, the biexponential decay images shown in Fig. 8(b, c) show similar spatial behavior for slow decay as shown in Fig. 8(c). The marked difference in the spatial profiles of the fast and slow decay components suggests a spatially varying distribution of the dark state in this sample.
SUMMARY
Coherent's Vitara laser represents an innovative and commercially available device for multidimensional coherence spectroscopy coupled to microscopy, which enables the study of spatially resolved optical coherence times, coherent coupling between excitons, and charge transfer in TMD heterostructures. In heterostructure samples, both coherent coupling and charge transfer exhibit a high degree of homogeneity, supporting large-scale applications of TMDs for photovoltaics and quantum information science. The example also highlights the power of MDCS combined with microscopy, which allows researchers to investigate sample dynamics across a sample with high reproducibility. Rapidly obtained maps of the phasing and population lifetime show sample quality more accurately than white light microscopy or resonant linear reflection.
By calibrating the phasing and population lifetime scales to a pristine, high-quality sample, we find that any deviation from the expected dynamics can indicate poorer sample quality. Furthermore, these measurements are significantly faster than photoluminescence or Raman spectroscopy, and therefore FWM imaging can be used to rapidly characterize TMDs and other two-dimensional materials, gallium arsenide, and many other in-situ materials.
For these measurements, the Coherent Vitara T ultrafast laser was selected because it offers broad tunability, large bandwidth, high stability with low noise, and ease of use. In addition, MDCS spectroscopy requires simultaneous excitation of all resonances of interest, which can only be achieved in a TMD heterostructure using a broadband laser such as the Vitara. The spectroscopic and imaging data also demonstrate the capabilities of the BIGFOOT ultrafast spectrometer and the NESSIE laser scanning microscope from MONSTR Sense Technologies. These devices focus the laser to a near-diffraction-limited point, enabling high resolution and strong nonlinear response using a laser oscillator.