Visualization of cells and cellular structures in three-dimensional form brings with it greater demands on image processing than in the case of classical 2D microscopy. Confocal microscopes allow to image and measure objects in a non-destructive way at very high resolution, and by scanning tens to hundreds of optical sections, it is possible to reconstruct the resulting image of a single area in 3D dimensions using a suitable analysis program. Imaris analytical software for 3D image reconstruction and visualization allows to observe the spatial arrangement of cellular structures, their interactions, global distribution and many other properties.
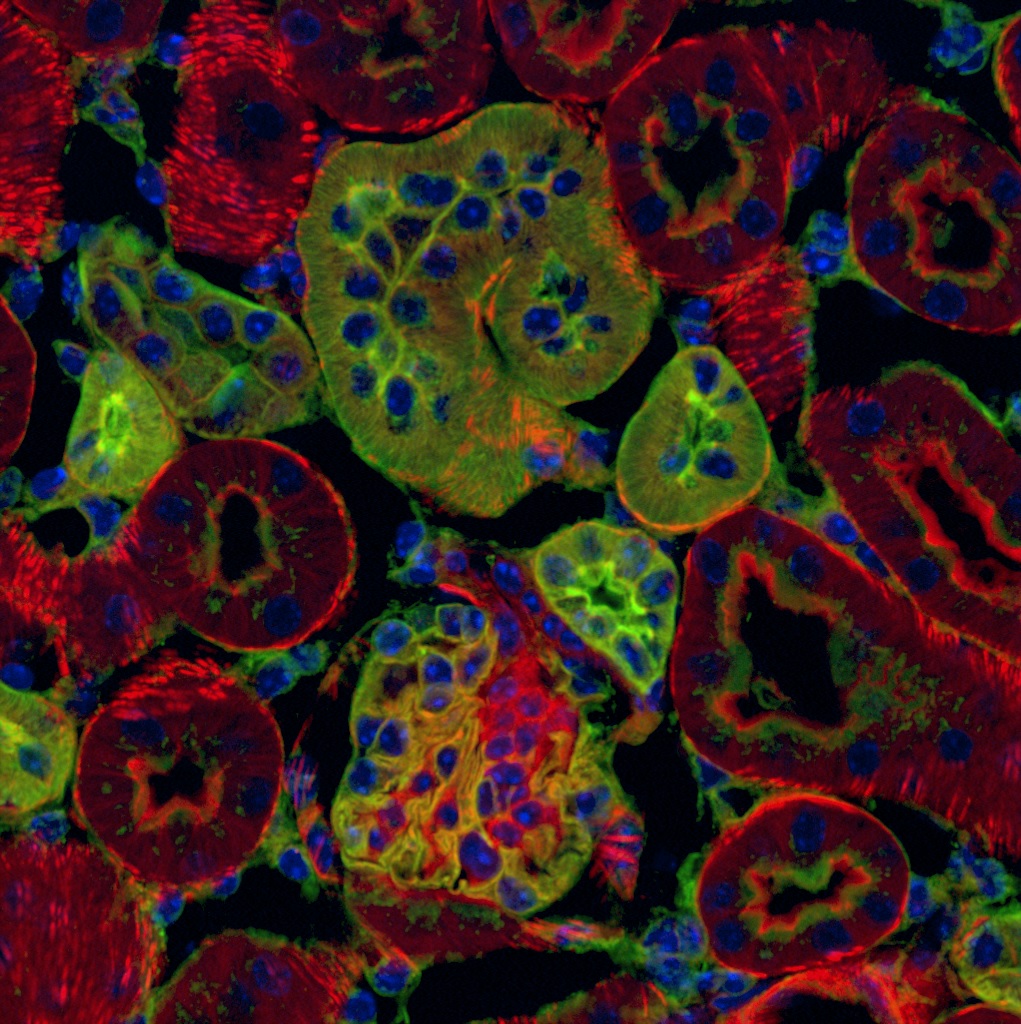
According to the authors of the study, information about the distribution of cellular interactions in bone marrow tissues can only be obtained by detailed visualization of the cell types in question and their quantification using spatial analysis. On the basis of this assumption, a remarkably large number of stromal cell components, sinusoidal endothelial cells and CXCL12 chemokine-rich mesenchymal reticular cells (CARcs), were analyzed in bone marrow by confocal microscopy, compared with the original estimates determined by conventional flow cytometry. In addition, both cell types were found to cluster into topologically complex networks, connect to each other via the ECM (note extracellular matrix) and permeate bone marrow tissue. The spatial characterization of stromal cells and other blood structures is critical for defining the microenvironment in which blood cells are maintained (niche).
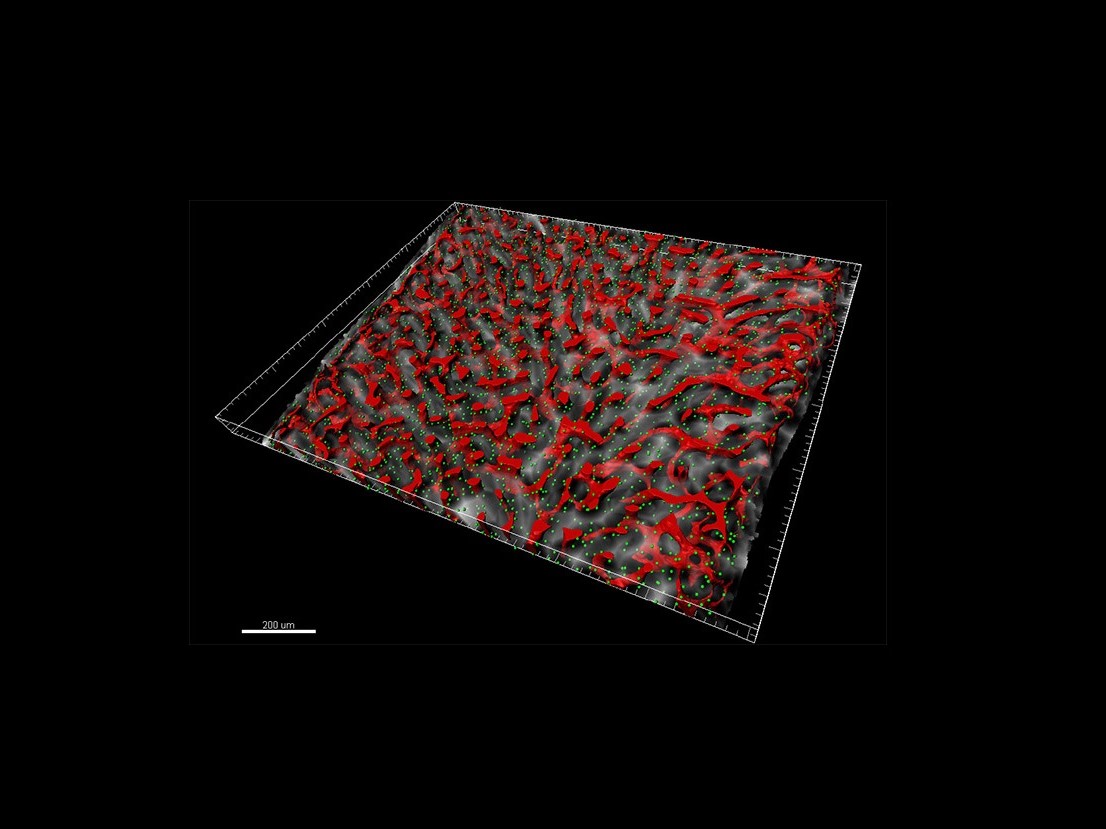
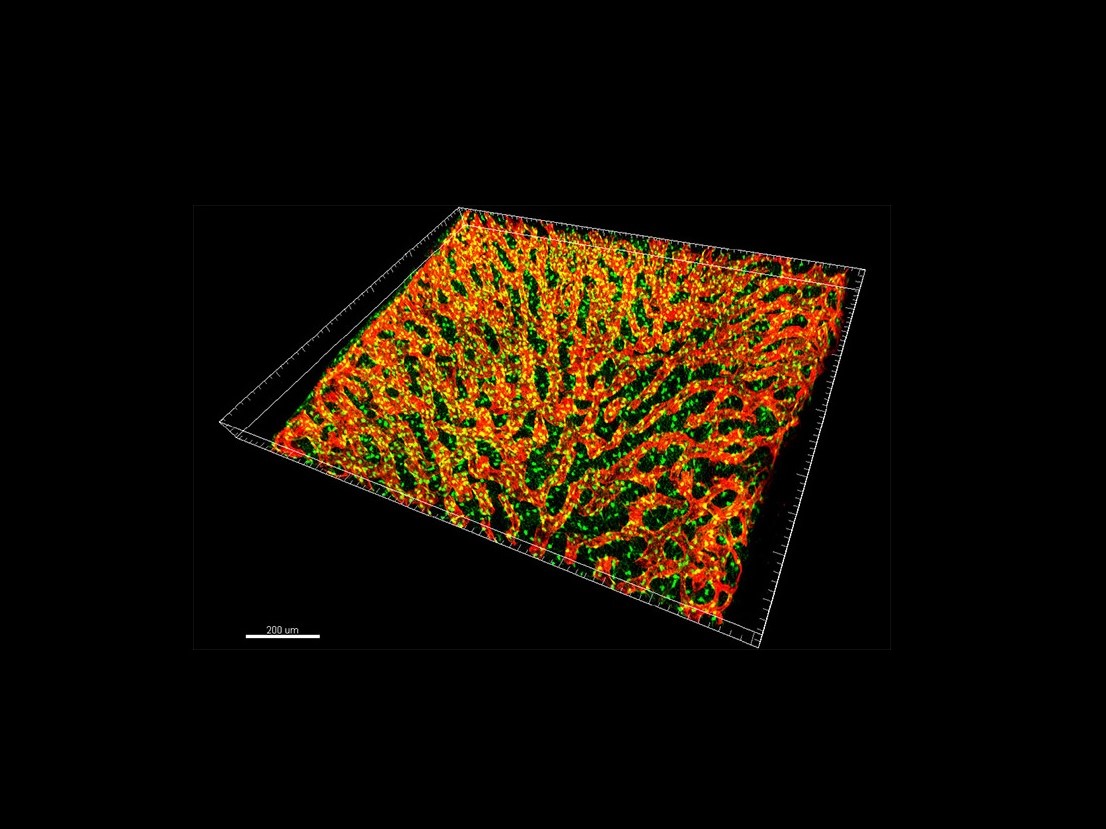
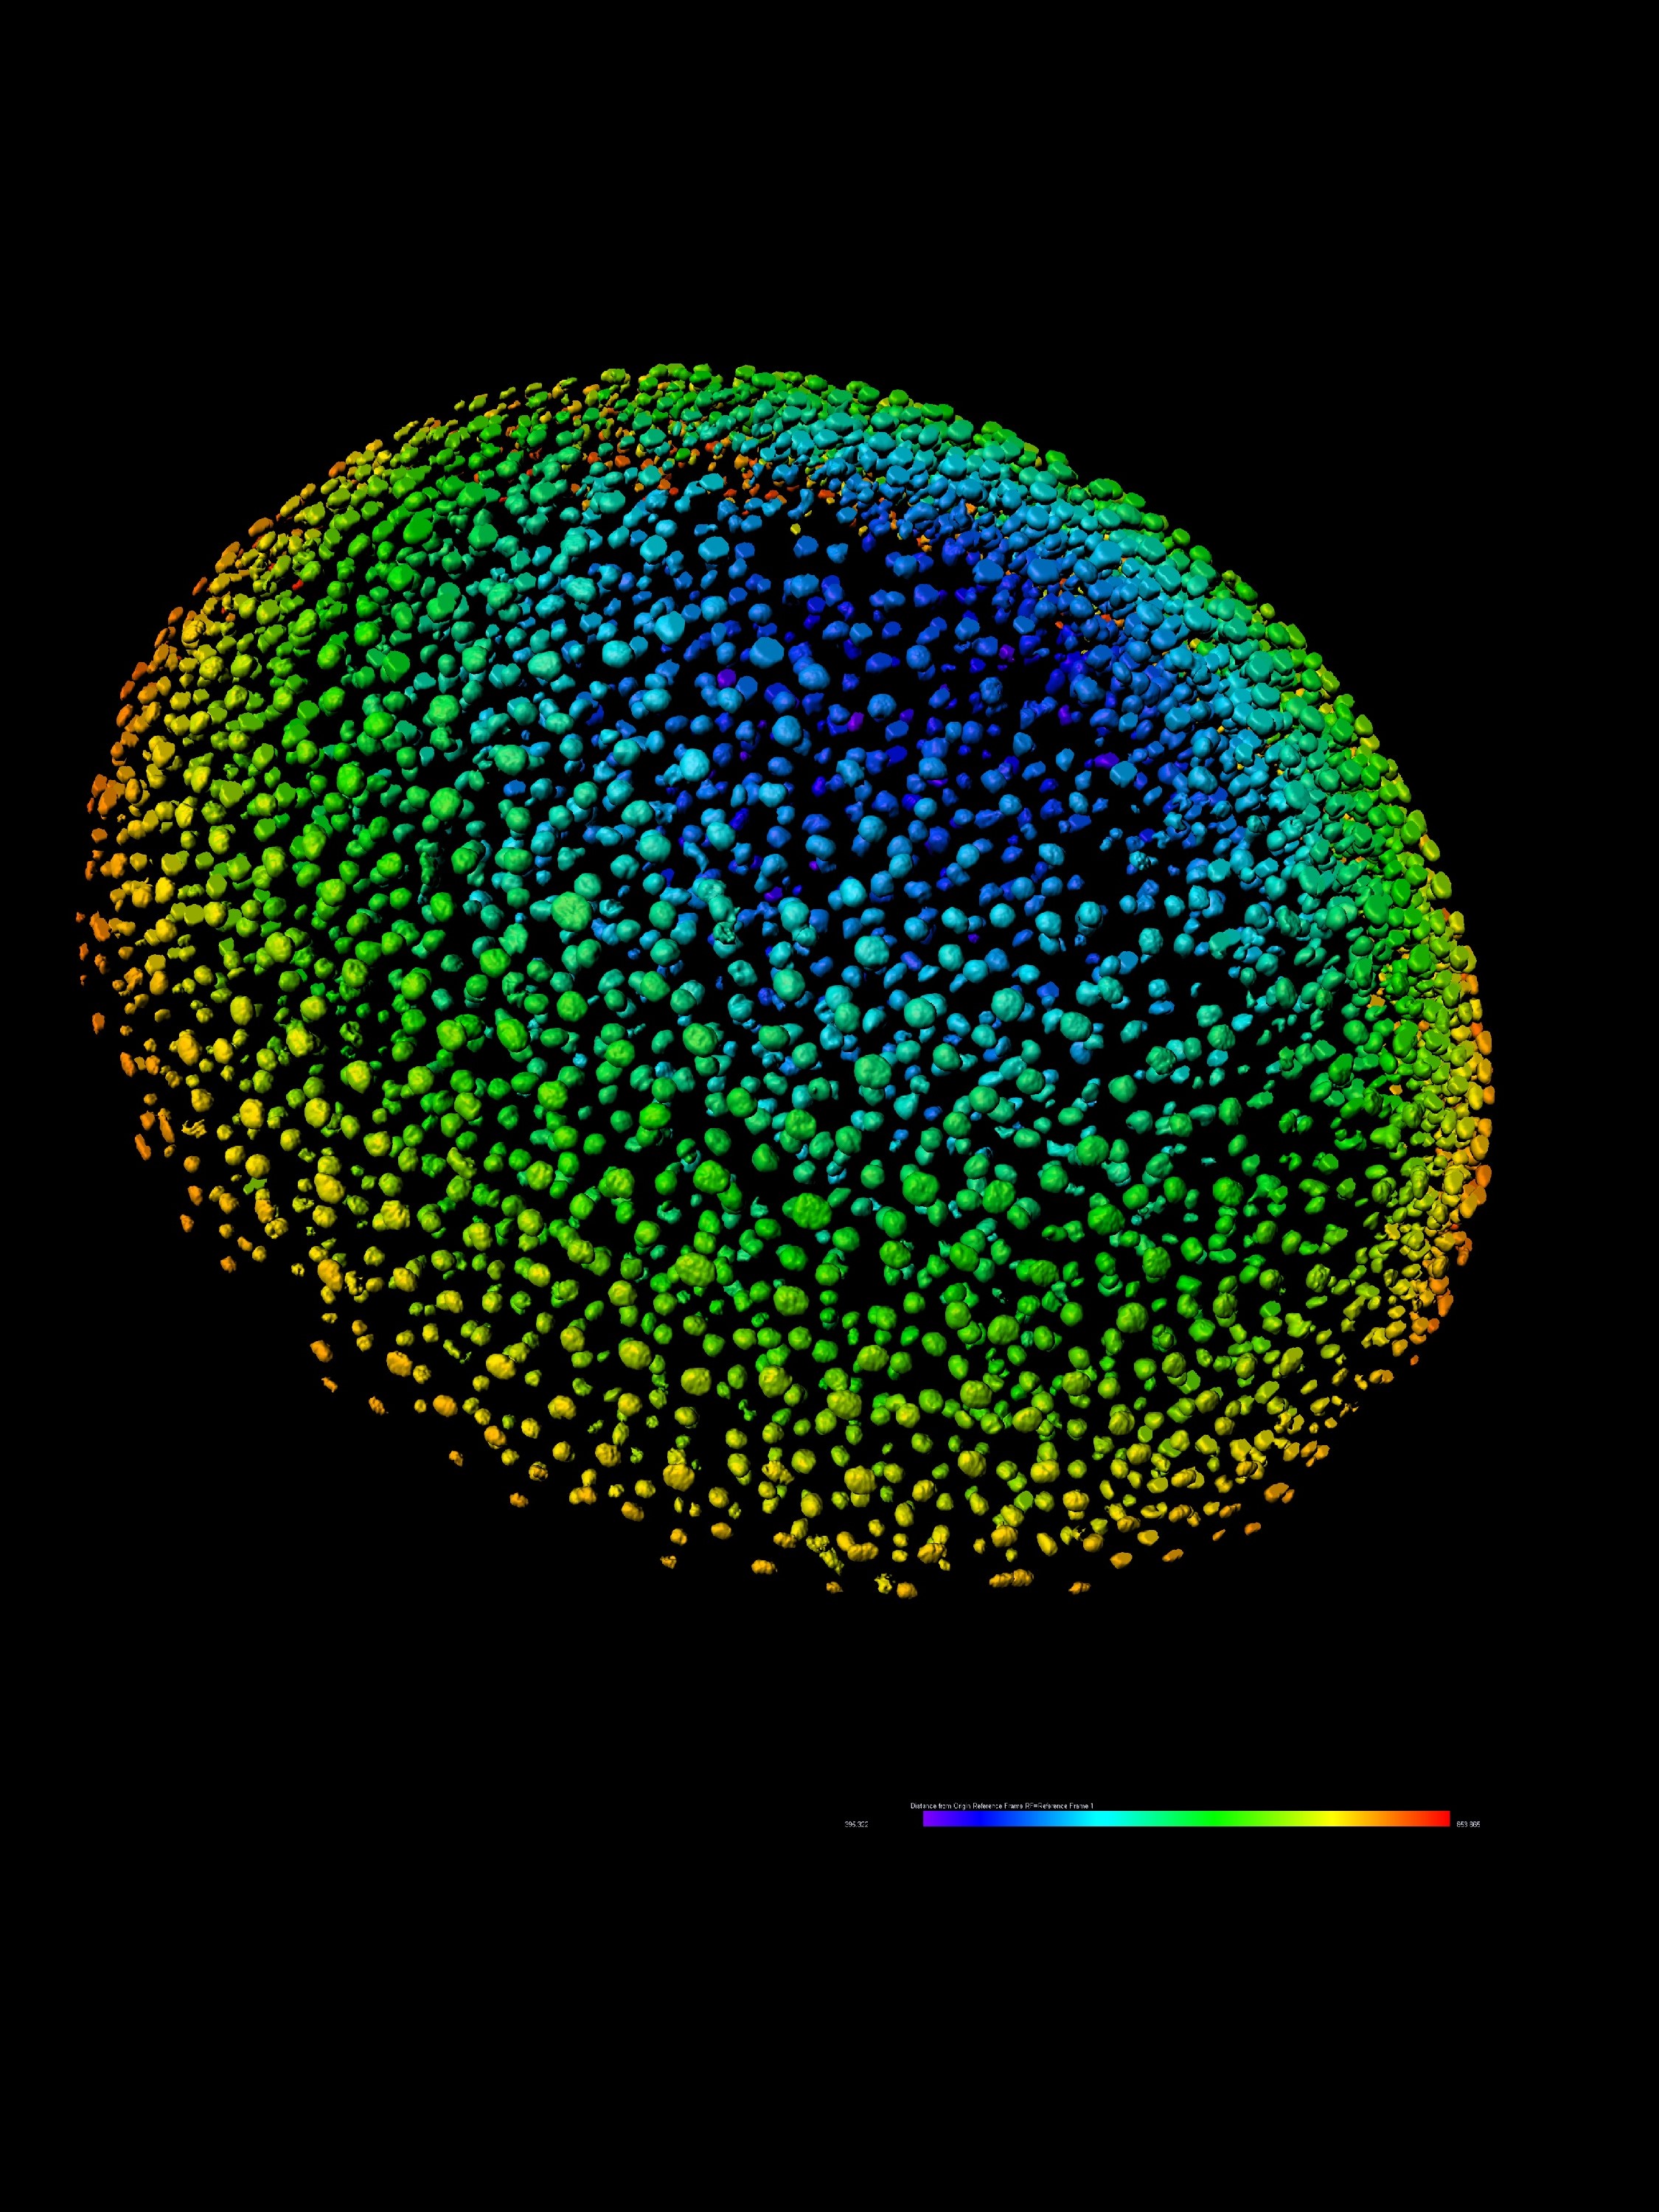
The authors of this study used several Imaris modules to analyze the number, distribution, and spatial distribution of CARcs and sinusoidal endothelial cells taken from the bone marrow of young and old mice. The Imaris Spots function was used to determine the coordinates of CARcs, and the Imaris Surfaces function was used to segment the endothelial walls of sinusoidal microvessels. Segmentation of the lumen (note inner part; translucency) of each microvessel presents a major challenge in image processing, as it does not emit any specific fluorescent signal. Using the Imaris programming interface, the researchers were able to create image processing tools to enable complete vascular segmentation and reconstruction using previously created surfaces in Imaris. They were also able to construct an analysis tool that uses points (cells) and surfaces (vessels or spatially extended structures) to study distribution and potential interactions.
The researchers plan to extend the visualisation and image processing capabilities by combining Imaris with their analysis software to identify cell types quickly, reliably and fully automatically. The goal is to create a detailed and integrated map of cellular anatomy in healthy and diseased bone marrow.
The Spots and Surfaces functions are part of the Imaris analytical software, which enables comprehensive analysis of image data obtained from confocal or light sheet microscopy and offers a wide range of functions for detecting and modelling biological structures, with the ability to check results at any point in the workflow. Imaris includes many special modules tailored to specific applications.
Key features of Imaris:
- Suitable for the detection of point objects: cells, bacteria, particles, protein clusters, vesicles, cell nuclei, centrosomes
- computation and 3D visualization of point or vesicle structures
- images with tens to hundreds of thousands of objects can be created
- calculation of XYZ coordinates of each object, relative distance between objects can be measured
- 3D tracking capability
- fast analysis of voluminous data (Fast Spots Technology - Imaris 9.2)
- Suitable for accurate visualization and measurement of: cells, cell organelles and nuclei, biofilms, tissues, organs, embryos, organoids
- computer-generated display of a selected region of the sample (ROI)
- visualization and calculation of data sets up to hundreds of GB in size
- tracking of objects over time (change in position, shape and intensity)
- measurement of area, volume, intensity, ellipticity and sphericity of objects
For more detailed information on quantitative 3D spatial analysis, please see the scientific article - Gomariz A, Nombela-Arrieta C. et al. "Quantitative spatial analysis of haematopoiesis-regulating stromal cells in the bone marrow microenvironment by 3D microscopy."
Videos
Quantitative 3D Spatial Analysis of Bone Marrow Tissues . www.bitplane.com.


